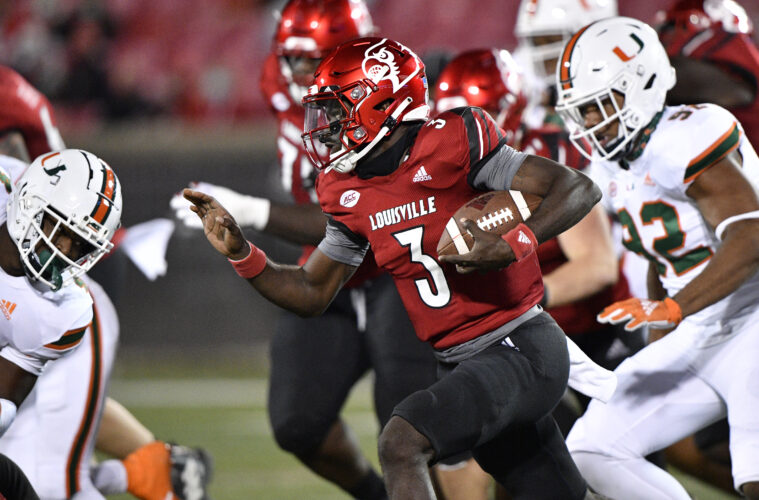
Louisville Football under Scott Satterfield rose its 3rd Down Conversion % by more than one percentage point from 2019 to 2020. The movement from 43.68% to 44.76% actually yielded a slip in the rankings (from 31st to 34th) as 3rd Down Conversions were up over the usual par in college football in 2020.
UofL held to a remarkably similar 444.2 ypg in 2020 as opposed to 447.3 ypg in 2019. Both years recorded Cardinal Football as a Top 30 Offense in yard per game. Still the Cards reduced their ppg by 3.6 ppg despite just a 3.1 yard per game differential.
Louisville’s 2013 season is the highest recent output in the last 18 seasons per game with Teddy Bridgewater at Quarterback and Charlie Strong coaching UofL. Louisville was 2nd in the nation in converting 3rd down in 2013 and 8th in the nation in 2012 with Teddy at QB. It is interesting that both seasons with Malik Cunningham UofL converts 3rd downs at a rate similar to either Lamar Jackson-led season.
If Louisville wants to move into Top 25 territory with its 3rd down conversions it will need to at least hold close to 44.50% (UofL was 44.76%) as the range for a Top 25 Third Down Conversion team is typically in the 44%-46%+ range. (As mentioned before 3rd down conversions were up in 2020 over previously measured seasons).
- Louisville Scoring Offense Evaluation
- Louisville Total Offense Evaluation
- Louisville Passing Offense Evaluation
- Louisville Rushing Offense Evaluation
- Louisville Scoring Defense Evaluation
- Louisville Total Defense Evaluation
- Louisville Passing Defense Evaluation
- Louisville Rushing Defense Evaluation
| – | 3rd Down % |
| 1 | 56.00%, 2nd (2013 Strong) |
| 2 | 49.73%, 8th (2012 Strong) |
| 3 | 47.97%, 9th (2005 Petrino) |
| 4 | 46.46%, 15th (2004 Petrino) |
| 5 | 45.96%, 16th (2006 Petrino) |
| 6 | 44.76%, 34th (2020 Satterfield) |
| 7 | 44.20%, 28th (2017 Petrino) |
| 8 | 43.68%, 31st (2019 Satterfield) |
| 9 | 43.04%, 31st (2007 Krag) |
| 10 | 41.11%, 60th (2016 Petrino) |
| 11 | 40.54%, 41st (2003 Petrino) |
| 12 | 39.89%, 60th (2010 Strong) |
| 13 | 39.36%, 75th (2011 Strong) |
| 14 | 39.20%, 76th (2014 Petrino) |
| 15 | 38.12%, 78th (2015 Petrino) |
| 16 | 37.85%, 72nd (2008 Krag) |
| 17 | 36.84%, 81st (2009 Krag) |
| 18 | 35.54%, 105th (2018 Petrino) |
No stat is universally correlated to wins or winning seasons, but 3rd Down Conversion % offensively and defensively is one of the more traditional indicators of a great season. Louisville’s Top 5 seasons in Third Down Conversion % over the past 18 years represents a 55-8 (87.3%) record for UofL with 4 bowl wins including Sugar & Orange Bowl victories.
- 56.00%, 2013. W-L, 12-1
- 49.73%, 2012. W-L, 11-2
- 47.97%, 2005. W-L, 9-3
- 46.46%, 2004. W-L, 11-1
- 45.96%, 2006. W-L, 12-1
What’s interesting is that Scott Satterfield’s 2020 team was 6th on these rankings and his team was 4-7 overall. So 3rd Down percentage isn’t EVERYTHING (especially when UofL had the 2nd worst turnover margin in the country in 2020, we’ll get to that later).
But maybe this is an indicator of good things to come for UofL football in 2021? In 2017 Louisville spent 6 weeks ranked and won 8 games, in 2019 Louisville won 8 games (also a Satt year), the 2007 was a disaster of a year with Steve Kragthorpe despite having Brian Brohm at quarterback. But 10th on the list is Lamar Jackson’s Heisman Trophy season in 2016 ranking just 60th that year in converting 3rd downs.
Latest posts by Mark Blankenbaker (see all)
- Cardinals Lose to Kentucky 17-13 in Battle of the Bluegrass - April 17, 2024
- Pat Kelsey Officially Adds Kloman, Carr, Hamilton, Foy to Staff - April 11, 2024
- Louisville Athletics, 502Circle Announce Membership Campaign - April 1, 2024

