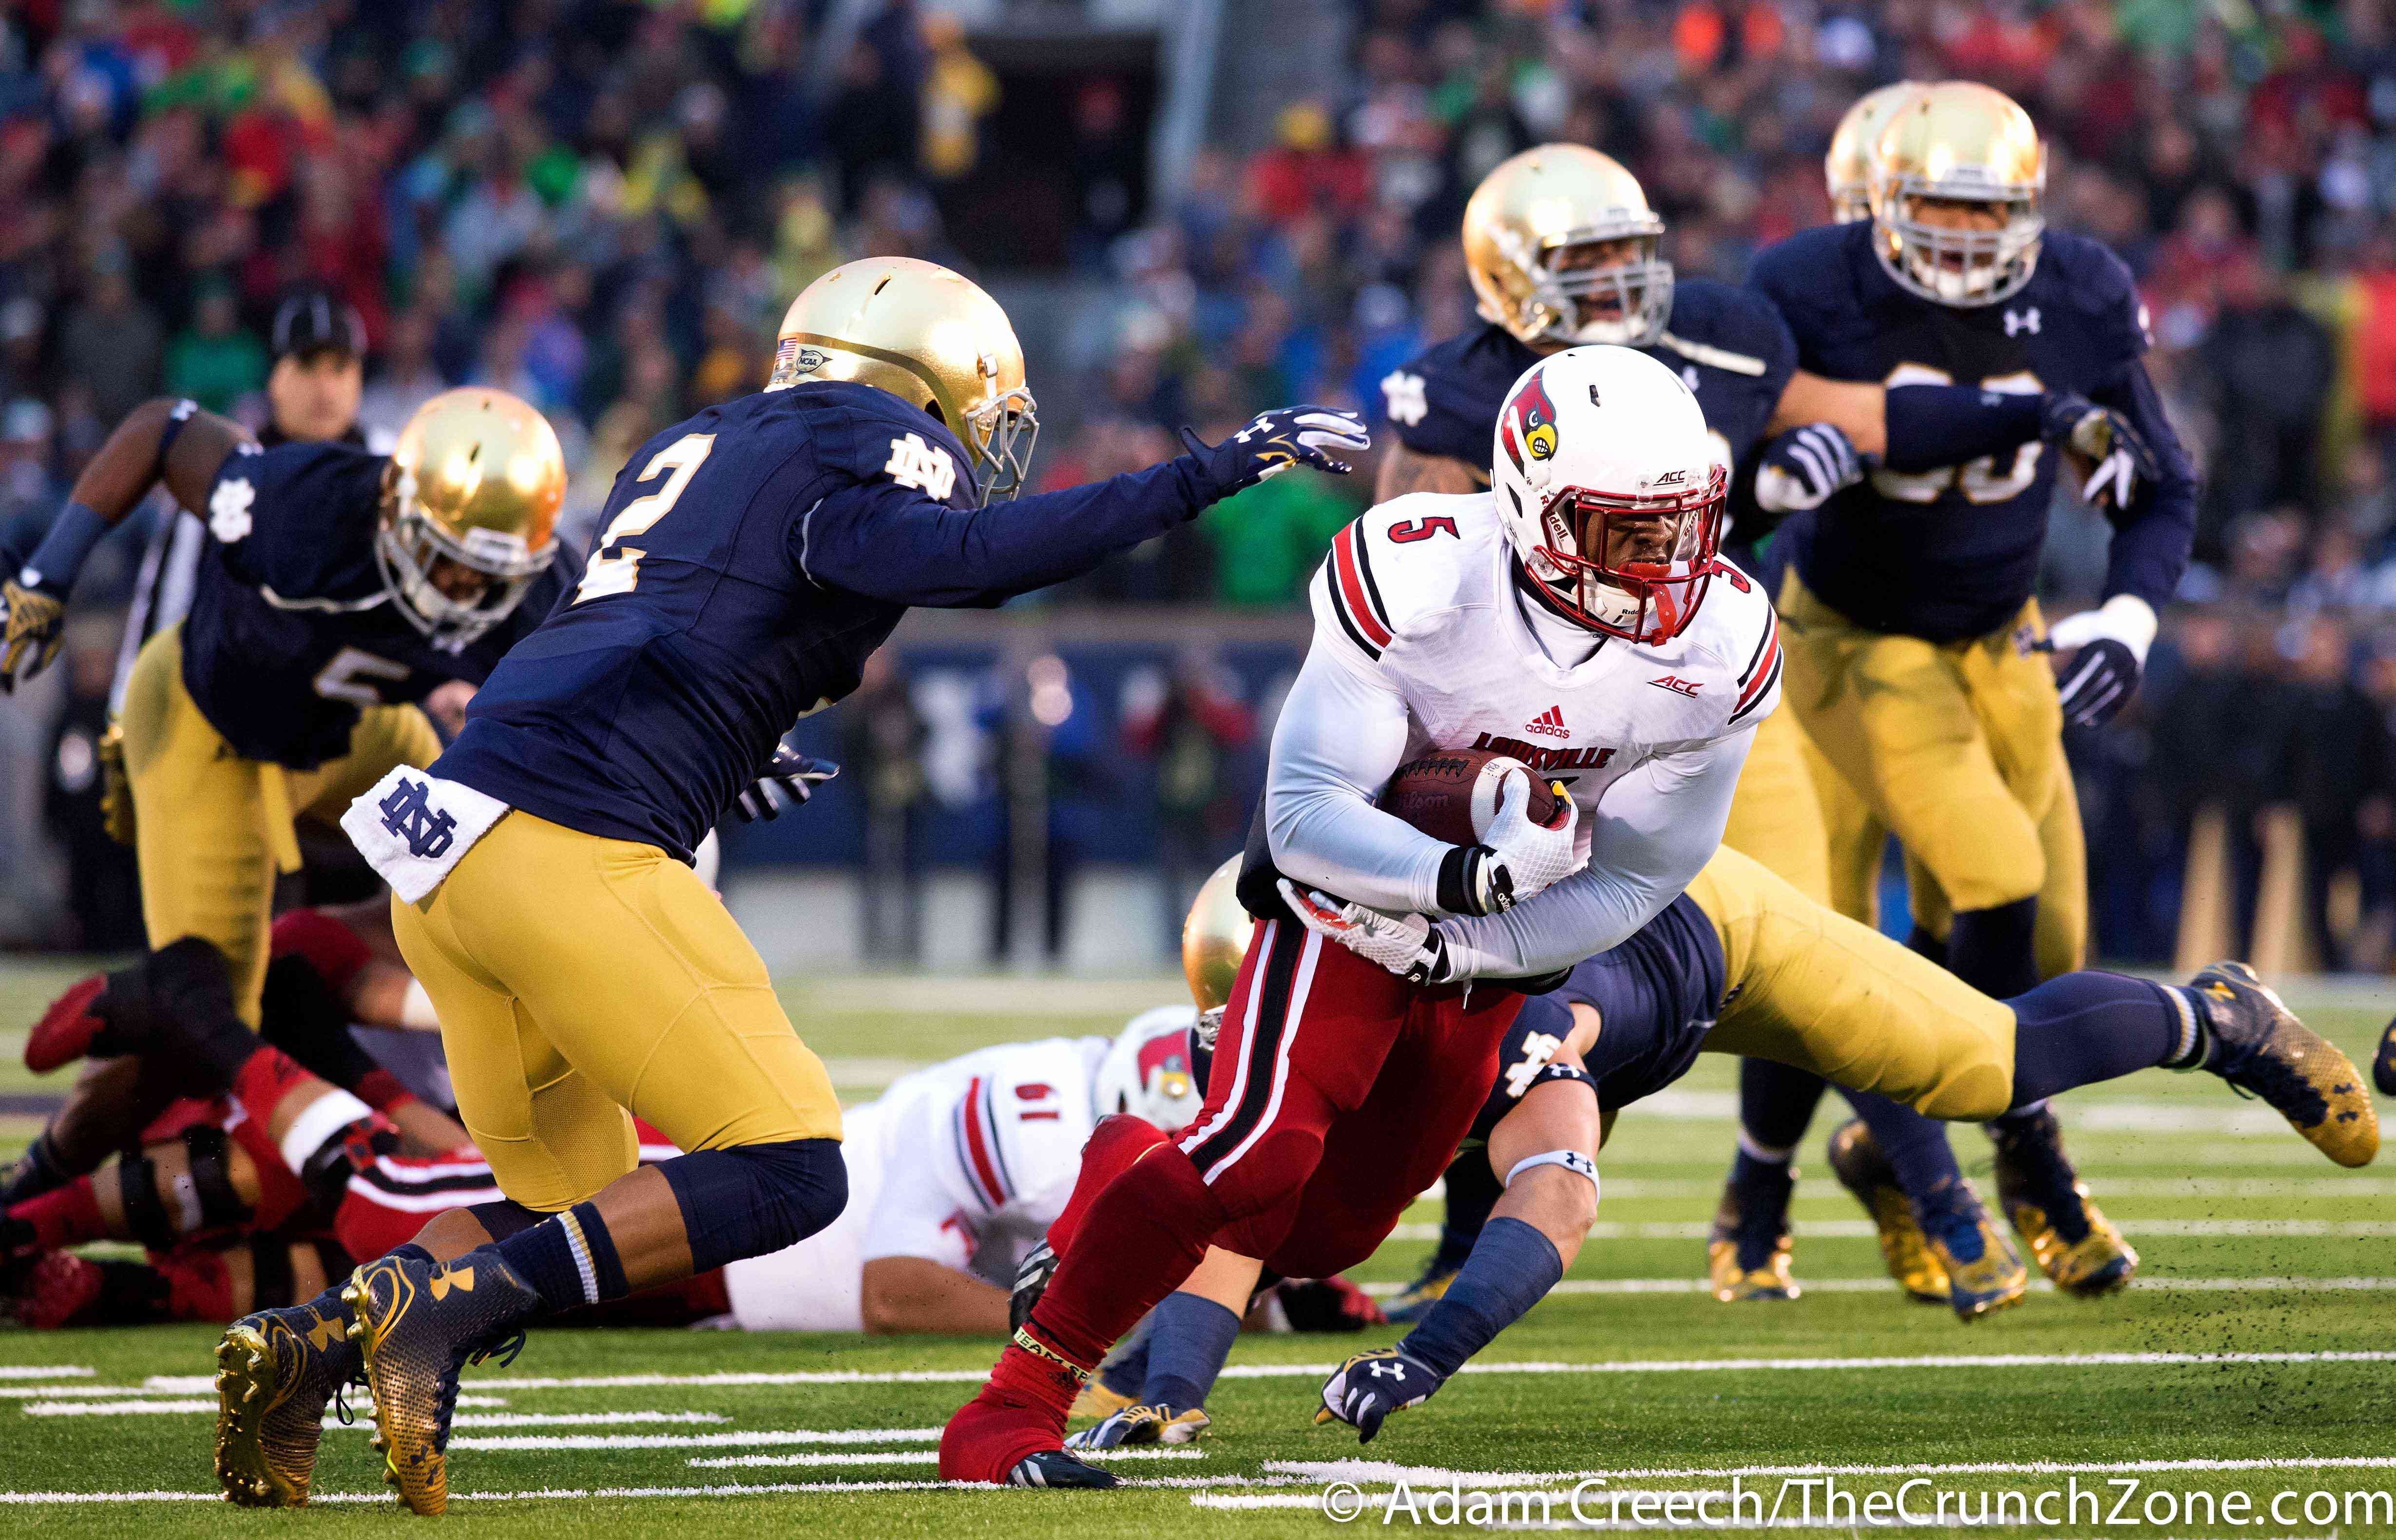
Hopefully this is the last time we ever look at these stats. Obviously Louisville & Notre Dame are different teams than they were in 2018, but this is what we have to go on statistically heading into Monday’s game versus the Irish.
What stands out is just how much better a 12-0 team looks on paper versus a 2-10 on paper. ND has the advantage in nearly every category. The Irish lose a great deal on defense, but do expect to build on a young offense with Ian Book and 4 starting offensive lineman returning. The Irish will be without tight end Cole Kmet and wide receivers Michael Young and Kevin Austin. The Cards will be without PJ Blue for the season and will not have the services of tight end Jordan Davis.
The question when reviewing these stats is: “How bad was Louisville REALLY? And how much did Louisville just give up and ALLOW these stats to get out of hand?” Many of these stats were pronounced in a negative way during the Cards 4 games during November suggesting that the Cards really did lose their will late in 2018. The result is a bunch of stats that were going to be bad…. made a great deal worse.
One stat that lies in here is the Louisville’s Passing Defense. Teams did not need to throw the ball against the Cards in 2018 and sportsmanship dictated that teams run the ball with the game in hand. The truth in the Passing Defense comes in the Passes Defended category where UofL Football was decidedly last.
Notre Dame wasn’t great at covering kickoffs or punts last year and they weren’t really that explosive offensively in 2018. That might be the few weaknesses of a team that a year ago made the college football playoff. Louisville meanwhile, was good a returning punts and bad at almost everything else.
| – | Louisville | Notre Dame |
| Strength of Schedule (Sagarin) | 15th | 19th |
| Scoring Offense (ppg) | 19.8 (122nd) | 31.4 (42nd) |
| Total Offense (ypg) | 352.6 (109th) | 440.1 (32nd) |
| Passing Offense (ypg) | 211.1 (89th) | 257.5 (37th) |
| Rushing Offense (ypg) | 141.50 (102nd) | 182.62 (51st) |
| Scoring Defense (ppg) | 44.1 (128th) | 18.2 (13th) |
| Total Defense (ypg) | 483.5 (122nd) | 347.4 (30th) |
| Passing Defense (ypg) | 206.3 (40th) | 207.9 (44th) |
| Rushing Defense (ypg) | 277.25 (127th) | 139.46 (36th) |
| Punt Returns (ypr) | 15.15 (8th) | 9.8 (57th) |
| Kickoff Returns (ypr) | 22.66 (33rd) | 21.23 (51st) |
| Opponent Punt Returns (ypr) | 9.96 (90th) | 8.28 (62nd) |
| Opponent Kickoff Return (ypr) | 20.76 (69th) | 23.09 (109th) |
| Punting (ypp) | 39.97 (88th) | 43.83 (16th) |
| Field Goal % | 83.3% (19th) | 81.8% (25th) |
| Opponent FG % | 73.3% (59th) | 56.0% (12th) |
| First Downs (per game) | 18.8 (106th) | 23.4 (27th) |
| Opponent First Downs (per game) | 23.3 (109th) | 19.9 (53rd) |
| Penalties (ypg) | 71.8 (121st) | 45.8 (34th) |
| Turnover Margin (season) | -12 (125th) | 4 (41st) |
| Time of Possession | 29:37.67 (73rd) | 29:03.77 (87th) |
| Sacks (Per Game) | 0.92 (126th) | 2.62 (32nd) |
| Tackles for Loss (Per Game) | 3.83 (127th) | 6.00 (65th) |
| Sacks Allowed (Per Game) | 3.58 (129th) | 1.92 (50th) |
| Tackles for Loss Allowed (Per Game) | 7.75 (124th) | 5.85 (56th) |
| Interceptions Gained (season) | 6 (112th) | 12 (40th) |
| Passes Defended (per game) | 27 (130th) | 76 (10th) |
| Fumbles Recovered (season) | 7 (82nd) | 9 (49th) |
| Fumbles Forced (season) | 5 (122nd) | 13 (31st) |
| Fumbles Lost (season) | 10 (82nd) | 4 (5th) |
| Interceptions Lost (Season) | 15 (115th) | 13 (90th) |
| Kick/Punts Blocked (season) | 2 (45th) | 2 (45th) |
| 3rd Down Conversion % | 35.54% (105th) | 43.01% (32nd) |
| 4th Down Conversion % | 36.36% (120th) | 64.00% (18th) |
| Opponent 3rd Down Conversion % | 51.85% (130th) | 38.86% (65th) |
| Opponent 4th Down Conversion % | 66.67% (114th) | 52.00% (69th) |
| Red Zone Conversion % | 80.56% (95th) | 86.54% (45th) |
| Red Zone TD Conversion % | 61.11% (70th) | 61.54% (65th) |
| Red Zone Trips | 36 (110th) | 52 (46th) |
| Opponent Red Zone Conversion % | 88.14% (103rd) | 75.00% (11th) |
| Opponent Red Zone TD Conversion % | 74.58% (119th) | 52.78% (27th) |
| Opponent Red Zone Trips | 59 (122nd) | 36 (19th) |
| Kickoffs (ypk) | 60.53 (83rd) | 62.04 (48th) |
| Plays | 797 (116th) | 954 (33rd) |
| Yards Per Play | 5.31 (100th) | 6.00 (47th) |
| Plays +10 Yards | 169 (86th) | 211 (23rd) |
| Plays +20 Yards | 54 (87th) | 74 (20th) |
| Plays +30 Yards | 21 (104th) | 30 (50th) |
| Plays +40 Yards | 11 (92nd) | 12 (83rd) |
| Opponent Plays +10 Yards | 171st (53rd) | 167 (45th) |
| Opponent Plays +20 Yards | 70 (102nd) | 43 (14th) |
| Opponent Plays +30 Yards | 38 (116th) | 17 (10th) |
| Opponent Plays +40 Yards | 18 (97th) | 8 (11th) |
Latest posts by Mark Blankenbaker (see all)
- Cardinals Lose to Kentucky 17-13 in Battle of the Bluegrass - April 17, 2024
- Pat Kelsey Officially Adds Kloman, Carr, Hamilton, Foy to Staff - April 11, 2024
- Louisville Athletics, 502Circle Announce Membership Campaign - April 1, 2024

