
We are less than 2 weeks from kickoff against Charlotte and, like many, I am craving anything to do with Louisville football. While we can debate who we think may win games and by how much, I thought it would be interesting to use the limited statistics available to try and piece this information together. First and foremost, here is Louisville’s 2015 schedule courtesy of cfbstats.com.
| Date | Opponent | Result | Game Time | Attendance |
|---|---|---|---|---|
| 09/05/15 | + Auburn | L 24-31 | 3:24 | 73,927 |
| 09/12/15 | 8 Houston | L 31-34 | 2:23 | 50,019 |
| 09/17/15 | 2 Clemson | L 17-20 | 3:10 | 55,396 |
| 09/26/15 | Samford | W 45-3 | 2:58 | 50,121 |
| 10/03/15 | @ North Carolina St. | W 20-13 | 3:21 | 56,417 |
| 10/17/15 | @ 14 Florida St. | L 21-41 | 3:14 | 71,225 |
| 10/24/15 | Boston College | W 17-14 | 3:13 | 41,486 |
| 10/30/15 | @ Wake Forest | W 20-19 | 3:25 | 24,922 |
| 11/07/15 | Syracuse | W 41-17 | 3:32 | 46,158 |
| 11/14/15 | Virginia | W 38-31 | 3:22 | 51,233 |
| 11/21/15 | @ Pittsburgh | L 34-45 | 3:20 | 42,119 |
| 11/28/15 | @ Kentucky | W 38-24 | 3:39 | 62,512 |
| 12/30/15 | + Texas A&M | W 27-21 | 4:01 | 50,478 |
| @ : Away, + : Neutral Site | ||||
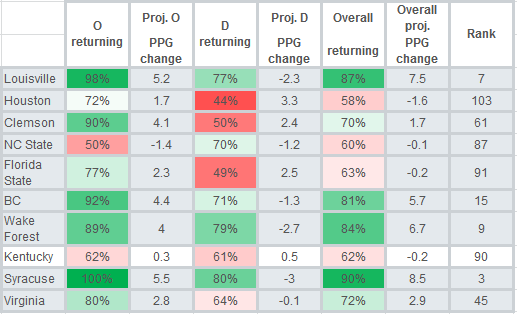
Since it is even more difficult to attempt to predict the results against teams Louisville didn’t face last year, I excluded those teams leaving 9 similar opponents between 2015 and 2016. Using information from footballstudyhall.com found HERE that attempts to quantify how a team’s offense and defense will change from 2015 to 2016 based on returning production, we get the following table.
Finally, when we take into account the previous years score and add it to the projected offensive/defensive points per game change, we get a projected score as follows.
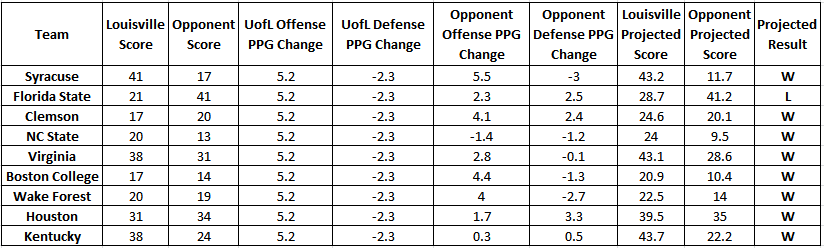
Obviously this isn’t the worlds most accurate method of predicting Louisville’s games in 2016, but it does show to some extent the possibilities given how much production Louisville does return. Not to mention, I would take those results in a heartbeat.
Chris Person
Latest posts by Chris Person (see all)
- Analyzing Louisville’s 2017 Defensive Front Seven Recruiting Class - February 1, 2017
- 4-Star Offensive Lineman Mekhi Becton Commits To Louisville - February 1, 2017
- 3-Star Offensive Lineman Toryque Bateman Commits To Louisville - January 30, 2017