

Earlier this month we took a look at Louisville’s Offensive S&P+ stats, found HERE. Now, we move on to the strength of recent Louisville teams, the defense. We will also take a look at FEI’s special teams ratings.
Note: All italicized text is taken directly from footballoutsiders.com.
The S&P+ Ratings are a college football ratings system derived from the play-by-play and drive data of all 800+ of a season’s FBS college football games (and 140,000+ plays).
The components for S&P+ reflect opponent-adjusted components of four of what Bill Connelly has deemed the Five Factors of college football: efficiency, explosiveness, field position, and finishing drives. (A fifth factor, turnovers, is informed marginally by sack rates, the only quality-based statistic that has a consistent relationship with turnover margins.)
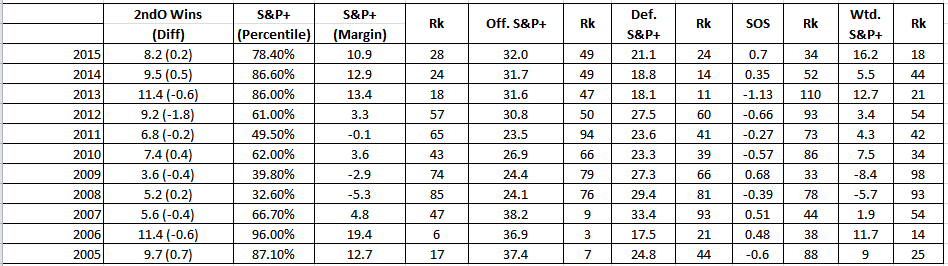
- Second-Order Wins (2ndO Wins): Second-order wins compare the advanced statistical components of a given game, and the single-game win expectancy they create, to the actual results of the game. This projected win total is a cousin of the Pythagorean record, a concept common in many sports. They are presented below, with the difference between a team’s wins and second-order wins in parentheses.
- S&P+ rating: Using the five-factors concept above, the S&P+ ratings take into account efficiency (Success Rates), explosiveness (IsoPPP), and factors related to field position and finishing drives. It is now presented in two forms: the first is a percentile, and the second is an adjusted scoring margin specific for this specific season’s scoring curve.
- Off. S&P+ rating: A team’s offense-specific S&P+ rating, presented in the form of an adjusted scoring average.
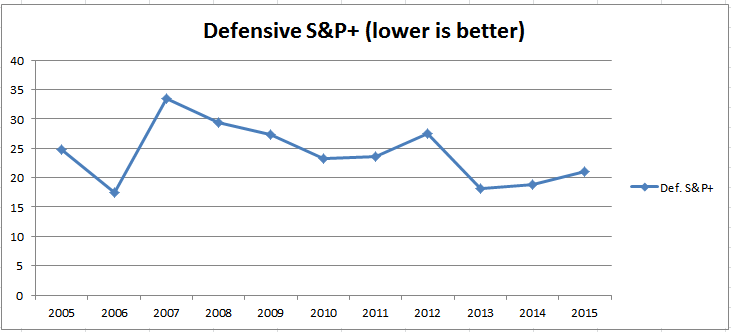
- Def. S&P+ rating: A team’s defense-specific S&P+ rating, presented in the form of an adjusted scoring average (and since this is defense, the lower the average, the better).
- Strength of Schedule rating (SOS): A simple schedule measure based on average S&P+ ratings and normal distributions.
- Weighted S&P+ rating: This is an attempt to measure how a team was playing at the end of a given season, with extra weight given to the most recent games. It is limited in power by small sample sizes, but it is useful in determining which teams finished strong and which derived most of their good (or bad) final ratings from early-season play.
Louisville 10 year S&P+ stats:
Defense:
- Success Rate: A common Football Outsiders tool used to measure efficiency by determining whether every play of a given game was successful or not. The terms of success in college football: 50 percent of necessary yardage on first down, 70 percent on second down, and 100 percent on third and fourth down.
- IsoPPP: An explosiveness measure derived from determining the equivalent point value of every yard line (based on the expected number of points an offense could expect to score from that yard line) and, therefore, every play of a given game. IsoPPP looks at only the per-play value of a team’s successful plays (as defined by the Success Rate definition above); its goal is to separate the explosiveness component from the efficiency component altogether.
Passing Downs are defined as:
- second down with 8 or more yards to go
- third or fourth down with 5 or more yards to go
All other downs are Standard Downs.
**Note: The lower number is better regarding the overall defensive S&P+, higher numbers are better on all other categories (rushing S&P+, passing S&P+, etc.)**
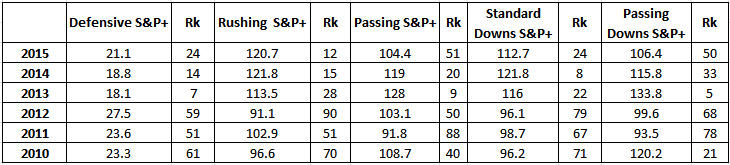
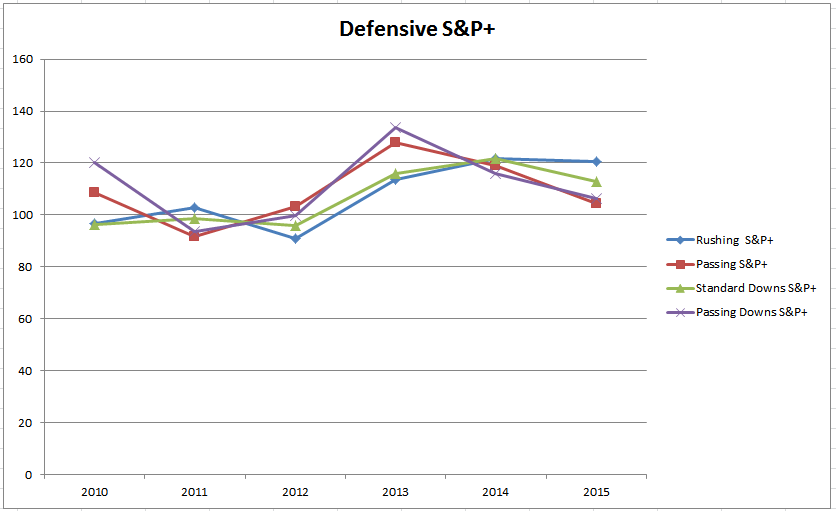
My take: While there has been a slight regression in the overall defensive S&P+ over the past few years, it is hard to find fault with how the defense performed last year. The unit still finished in the top 25 nationally in overall defense and was ranked #12 in rushing defense. If there was one area to focus on in the upcoming year, it would be passing defense and passing down defense, ranked 51 and 50 respectively.
Defensive Line
Run-blocking stats
- Adjusted Line Yards: One of only two opponent-adjusted numbers on the page, this aligns with the ALY figure FO tracks for the NFL and is presented on a scale in which 100.0 is perfectly average, above 100 is good, below 100 is bad.
- Standard Downs Line Yards per Carry: The raw, unadjusted per-carry line yardage for a team on standard downs (first down, second-and-7 or fewer, third-and-4 or fewer, fourth-and-4 or fewer).
- Passing Downs Line Yards per Carry: The same unadjusted averages for rushing on passing downs.
- Opportunity Rate: The percentage of carries (when five yards are available) that gain at least five yards, i.e. the percentage of carries in which the line does its job, so to speak.
- Power Success Rate: Percentage of runs on third or fourth down, two yards or less to go, that achieved a first down or touchdown.
- Stuff Rate: Percentage of carries by running backs that are stopped at or before the line of scrimmage.
Pass-blocking stats
- Adjusted Sack Rate: An opponent-adjusted version of a team’s sack rate — sacks divided by (sacks plus passes), presented on a scale in which 100 is perfectly average, above 100 is good, below 100 is bad.
- Standard Downs Sack Rate: Unadjusted sack rate for standard downs pass attempts.
- Passing Downs Sack Rate: Unadjusted sack rate for passing downs pass attempts.
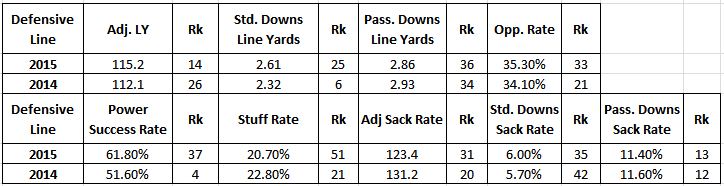
My take: Once again the Louisville defensive line was one of the strengths of the defense, ranking 14th nationally in adjusted line yards and 13th nationally in pass downs sack rate. One area that the unit did regress on was stuff rate and power success rate. In a sense, when the line pinned their ears back and brought pressure, they were very successful. Conversely, they struggled a little stopping running backs behind the line of scrimmage (51st in stuff rate nationally) and preventing running backs from picking up short yardage first downs (37th in power success rate nationally compared to 4th in 2014). The loss of Sheldon Rankins is a little concerning when you consider his versatility and talent on the defensive line. Despite this, the unit still has plenty of talent returning so it will be interesting to see how this evolves over the course of the 2016 season.
Special Teams
The Fremeau Efficiency Index (FEI) is a college football rating system based on opponent-adjusted drive efficiency. Other definitions:
- FGE: Field Goal Efficiency, the scoring value generated per field goal attempt.
- PRE: Punt Return Efficiency, the scoring value generated per opponent punt.
- FGE: Kickoff Return Efficiency, the scoring value generated per opponent kickoff.
- PE: Punt Efficiency, the scoring value generated per punt.
- KE: Kickoff Efficiency, the scoring value generated per kickoff.
- Opp FGE: Opponent Field Goal Efficiency, the scoring value generated per opponent field goal attempt. Opp FGE is not included in STE ratings.

My take: The special teams were not all that special in 2015 to put it bluntly, ranking in the middle of the pack in almost all categories. One area that Louisville did make positive strides in from 2014 to 2015 was punt return efficiency, almost solely due to Jaire Alexander. Alexander is one facet of the team I am most excited to see in 2016 as I believe he has the potential to be a top punt returner nationally. Another area that improved dramatically was punting, which jumped from 116th nationally in 2014 to 58th nationally in 2015. An area of concern I do have is field goal efficiency. Dropping from 26th nationally in 2014 to 61st nationally in 2015 isn’t as big of a deal as is the loss of kicker John Wallace. Who will step up in 2016 to take the sometimes undervalued kicker spot? This is something Coach Petrino hopes to have ironed out in fall camp, well before the season begins.
Chris Person
Latest posts by Chris Person (see all)
- Analyzing Louisville’s 2017 Defensive Front Seven Recruiting Class - February 1, 2017
- 4-Star Offensive Lineman Mekhi Becton Commits To Louisville - February 1, 2017
- 3-Star Offensive Lineman Toryque Bateman Commits To Louisville - January 30, 2017