
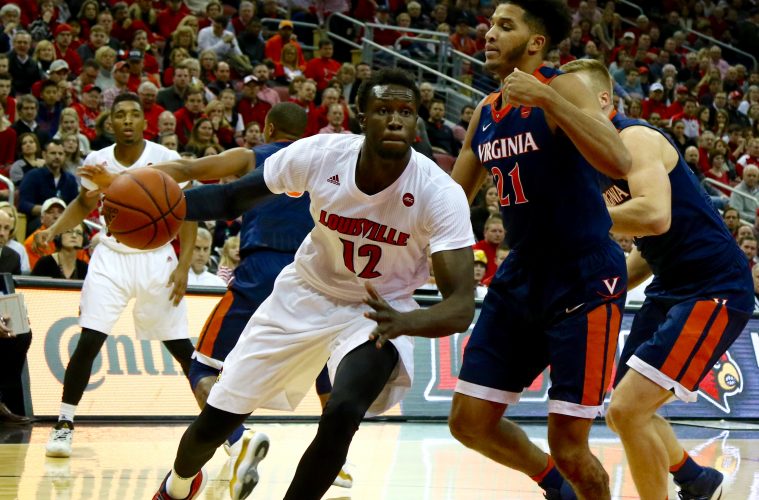
Louisville travels to Charlottesville to face the #2 Virginia Cavaliers. The trek to UVA, or playing the Wahoos at all recently has been an absolute chore since the Cards joined the ACC as UofL is 1-5 since the 2014-15 season. The sole victory came on a Mangok Mathiang ‘prayer’ at the buzzer. Louisville is 0-3 vs. the Cavs in Charlottesville as well.
But it’s not just the 5 losses that makes Virginia such a tough game. It’s the manner in which Lousiville plays while playing against Tony Bennett’s squad and how badly they are beaten. In the 5 games here are the point differentials: 5 points, 16 points, 22 points, 8 points, 16 points. And 8 points vs. UVA might as well be 100. Virginia takes the air out of the ball, they take FOREVER to pick up the ball to inbound after makes thereby forcing defenses to play extra time (and shortening the clock). Defensive rebounding and forcing misses is at a PREMIUM. Also Lousiville must value the ball on each possession as well. The trouble with playing Virginia is that they frustrate teams to do things they are accustomed to doing and they take advantage of teams who rush to try to catch up.
But Louisville has struggled vs. Virginia FOREVER, even in the 80s when the Cards had things ROLLING. Before Tony Bennett even Denny Crum struggled to beat Virginia. Louisville also lost a 1924 contest 41-26 to UVA when the Cards were coached by Fred Enke. Peck Hickman DID prevail over UVA in 1947 and Denny did finally figure out the Cavaliers after starting 0-4 in 1982-1985 and finally got on the right side in 1989 & 1990. Overall Louisville is 4-10 all-time versus Virginia.
| Louisville | Virginia | |
| Strength of Schedule (Ken Pom) | 69th | 33rd |
| PPG | 78.5 (52nd) | 69.0 (261st) |
| Avg Scoring Margin | 9.6 (39th) | 16.8 (7th) |
| Field Goal % | 45.5% (112th) | 46.5% (74th) |
| Effective FG% | 51.6% (135th) | 53.3% (78th) |
| 2-pt FG % | 51.5% (111th) | 50.7% (144th) |
| 3-pt FG % | 34.6% (186th) | 38.6% (43rd) |
| FT % | 74.4% (71st) | 76.8% (21st) |
| FT Attempted Per Game | 19.5 (168th) | 13.8 (346th) |
| Opp FT Attempted Per Game | 18.5 (138th) | 12.4 (1st) |
| Rebound Rate | 50.7% (137th) | 50.7% (137th) |
| Blocks Per Game | 7.1 (2nd) | 4.3 (56th) |
| Steals Per Game | 7.8 (28th) | 7.7 (31st) |
| Assists Per Game | 13.5 (160th) | 13.7 (148th) |
| Turnovers Per Game | 12.2 (79th) | 9.2 (1st) |
| Opp Turnovers Per Game | 14.8 (62nd) | 14.6 (74th) |
| Team Fouls Per Game | 17.0 (85th) | 14.0 (2nd) |
| Opp Shooting % | 38.9% (7th) | 37.0% (3rd) |
| Opp Effective FG% | 44.3% (7th) | 42.6% (3rd) |
| Opp 2-pt FG % | 43.5% (10th) | 42.0% (5th) |
| Opp 3-Pt FG % | 30.5% (10th) | 29.1% (5th) |
| Opp Blocks Per Game | 2.9 (84th) | 2.9 (84th) |
| Opp Steals Per Game | 6.5 (225th) | 4.2 (4th) |
Latest posts by Mark Blankenbaker (see all)
- Pat Kelsey Adds Associate Head Coach Sean Dixon - April 10, 2026
- Baseball: Cardinals Take 4-2 Loss at Kentucky - April 7, 2026
- Pat Kelsey Hires John Andrzejek as Associate Head Coach - April 6, 2026