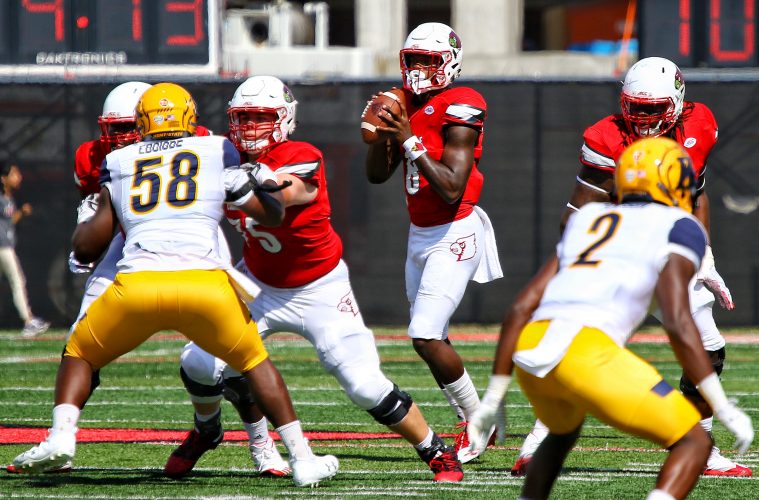
Since Lousiville’s opponent this week is FCS Murray State there is no way to adequately do a stat comparison. So this week, 33.3% complete in the season let’s take a look at how the Cards look against themselves over the past 15 seasons (sometimes 10) statistically.
There are some standout performances: Most yards per game in 15 seasons, most first downs per game, most tackles for loss, and kicks blocked. And there are some not so great metrics thus far as well: Scoring Defense, Total Defense, Passing Defense, Opponent First Downs, and Opponent Red Zone conversions.
| Louisville | Rank Over Last 15 Years | Best/Worst | |
| Strength of Schedule (Sagarin) | 12th | ||
| Scoring Offense (ppg) | 36.3 (40th) | 5th | 49.8/18.1 |
| Total Offense (ypg) | 550.3 (8th) | 1st | 550.3/333.0 |
| Passing Offense (ypg) | 365.5 (7th) | 2nd | 337.2/194.0 |
| Rushing Offense (ypg) | 184.75 (53rd) | 6th | 250.4/121.54 |
| Scoring Defense (ppg) | 28.3 (85th) | 13th | 12.2/33.4 |
| Total Defense (ypg) | 377.0 (64th) | 13th | 251.5/429.7 |
| Passing Defense (ypg) | 251.0 (87th) | 14th | 167.4/261.2 |
| Rushing Defense (ypg) | 126.0 (48th) | 9th | 80.69/168.5 |
| Punt Returns (ypr) | 7.25 (62nd) | 7th (10 yr) | 12.61/4.25 |
| Kickoff Returns (ypr) | 22.44 (50th) | 5th (10 yr) | 25.49/17.31 |
| Opponent Punt Returns (ypr) | 3.60 (33rd) | 3rd (10 yr) | 0.54/9.63 |
| Opponent Kickoff Return (ypr) | 20.72 (78th) | 2nd (10 yr) | 20.39/24.82 |
| Punting (ypp) | 42.14 (59th) | 2nd (10 yr) | 43.87/37.31 |
| Field Goal % | 100% (1st) | 1st (13 yr) | 100%/45.5% |
| Opponent FG % | 60% (29th) | 4th (10 yr) | 52.6%/88.5% |
| First Downs (per game) | 26.5 (13th) | 1st (10 yr) | 26.5/16.5 |
| Opponent First Downs (per game) | 20.3 (71st) | 13th | 14.1/22.9 |
| Penalties (ypg) | 59.0 (79th) | 8th | 44.8/70.7 |
| Turnover Margin (season) | -1 (73rd) | 6th (10 yr) | 2nd/111th |
| Time of Possession | 28:53.25 (84th) | 13th | 33:49.31/28:09.0 |
| Sacks (Per Game) | 3.00 (19th) | 5th | 3.7/1.17 |
| Tackles for Loss (Per Game) | 8.00 (17th) | 1st (10 yr) | 8.00/4.54 |
| Sacks Allowed (Per Game) | 2.00 (68th) | 5th | 0.8/3.62 |
| Tackles for Loss Allowed (Per Game) | 4.5 (24th) | 1st (10 yr) | 4.5/7.67 |
| Interceptions (season) | 4 (4th) | 2nd | 1st/99th |
| Passes Defended (per game) | 5.5 (25th) | 2nd (10 yr) | 5.92/2.92 |
| Fumbles Recovered (season) | 3 (34th) | 3rd (10 yr) | 29th/120th |
| Fumbles Forced (season) | 4 (27th) | 3 (10 yr) | 12th/107th |
| Fumbles Lost (season) | 5 (109th) | 6th (10 yr) | 5th/128th |
| Kick/Punts Blocked (season) | 2 (5th) | 1st | 5th/128th |
| 3rd Down Conversion % | 43.86% (41st) | 6th | 56.00%/36.84% |
| 4th Down Conversion % | 50.00% (56th) | 9th | 69.23%/33.33% |
| Opponent 3rd Down Conversion % | 39.29% (78th) | 12th | 26.74%/43.37% |
| Opponent 4th Down Conversion % | 57.14% (74th) | 12th | 25.00%/66.67% |
| Red Zone Conversion % | 84.21% (69th) | 6th | 92.98%/71.43% |
| Red Zone TD Conversion % | 57.89% (79th) | ||
| Opponent Red Zone Conversion % | 90.00% (97th) | 15th | 68.42%/90.00% |
| Opponent Red Zone TD Conversion % | 80.00% (117th) | ||
| Kickoffs (ypk) | 61.64 (82nd) | 6th (10 yr) | 67.05/59.68 |
| Plays | 288 (41st) | ||
| Yards Per Play | 7.64 (4th) | ||
| Per Game Figures Ranked By Stat | |||
| Per Season Figured Ranked by Rank |
The following two tabs change content below.


@UofLSheriff50. Louisville native, University of Louisville Business School Grad c/o 2004. Co-Founder of TheCrunchZone.com
Latest posts by Mark Blankenbaker (see all)
- Cardinals Lose to Kentucky 17-13 in Battle of the Bluegrass - April 17, 2024
- Pat Kelsey Officially Adds Kloman, Carr, Hamilton, Foy to Staff - April 11, 2024
- Louisville Athletics, 502Circle Announce Membership Campaign - April 1, 2024

