
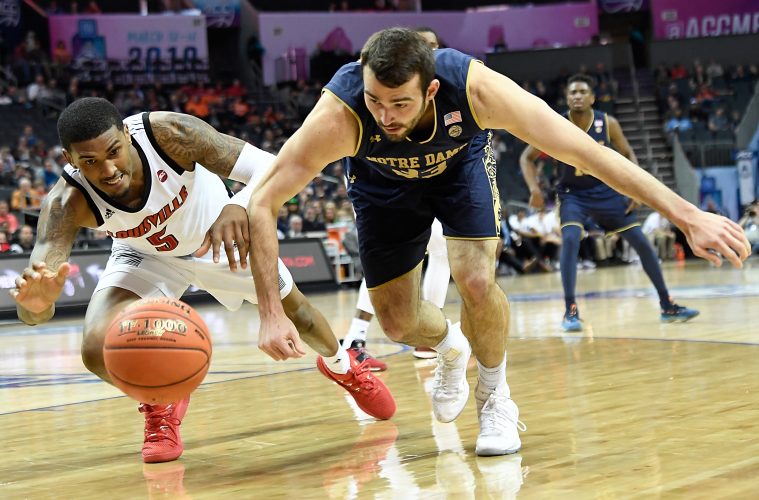
Louisville will travel to South Bend, IN on Saturday to face-off against the Notre Dame Fighting Irish inside the Joyce Center. The Irish under Mike Brey have been short-handed for the second consecutive season (they played only 6 players on Wednesday night vs. NC State) and the results have been mixed early in the 2019-2020 season.
But better Louisville teams and worse Notre Dame teams have resulted in incredibly tough games inside the Joyce Center during this series.
ND started the season with a loss on the road vs. North Carolina and then won 6 in a row before losing two-games in a row in early December to Maryland & Boston College. The Irish have also lost to Indiana and NC State. To date the best wins of the season came against UCLA and Syracuse.
Statistically the Irish are a high-scoring team…. but they also see a very high number of possessions in relation to the rest of college basketball. They shoot OK from the field. Notre Dame does NOT foul. ND is #1 in the nation in team fouls and that’s necessary considering the short bench Mike Brey has to deal with. As such they don’t rebound super-aggressively on the offensive end.
The one stand out stat categories beyond the lack of fouls is the overall defense, the # of assists and lack of turnovers. This is a well-coached team despite its limited roster. Louisville will have to beat Notre Dame as the Irish are not going to beat themselves.
| – | Louisville | Notre Dame |
| Strength of Schedule (Ken Pom) | 106th | 259th |
| PPG | 75.3 (68th) | 75.6 (64th) |
| Avg Scoring Margin | 14.3 (14th) | 10.1 (38th) |
| Field Goal % | 46.9% (33rd) | 42.6% (198th) |
| Effective FG% | 53.7% (35th) | 50.5% (126th) |
| 2-pt FG % | 52.6% (66th) | 49.0% (176th) |
| 3-pt FG % | 37.0% (41st) | 34.8% (98th) |
| FT % | 71.5% (136th) | 70.7% (157th) |
| Team Fouls Per Game | 16.3 (89th) | 11.9 (1st) |
| Opp Team Fouls Per Game | 17.1 (217th) | 15.4 (312th) |
| FT Attempted Per Game | 18.5 (169th) | 16.4 (263rd) |
| Opp FT Attempted Per Game | 14.8 (45th) | 11.5 (3rd) |
| Opp Shooting % | 36.5% (5th) | 39.3% (41st) |
| Opp Effective FG% | 42.4% (9th) | 45.7% (61st) |
| Opp 2-pt FG % | 41.8% (12th) | 43.1% (25th) |
| Opp 3-Pt FG % | 28.8% (31st) | 33.2% (180th) |
| Rebound Rate | 55.3% (14th) | 50.5% (143rd) |
| Assists Per Game | 14.7 (59th) | 18.3 (3rd) |
| Turnovers Per Game | 12.3 (70th) | 9.9 (2nd) |
| Blocks Per Game | 2.9 (183rd) | 4.4 (49th) |
| Steals Per Game | 4.7 (334th) | 6.1 (199th) |
| Opp Turnovers Per Game | 10.9 (338th) | 12.9 (222nd) |
| Opp Blocks Per Game | 2.3 (19th) | 3.3 (187th) |
| Opp Steals Per Game | 5.5 (47th) | 5.1 (23rd) |
Latest posts by Mark Blankenbaker (see all)
- Cards Advance to NCAA 2nd Round With Win Over South Florida 83-79 - March 19, 2026
- VIDEO: Pat Kelsey, Conwell, Fru & McKneely South Florida Post-Game (1st Round) - March 19, 2026
- UofL Statement on Mikel Brown’s Health - March 18, 2026