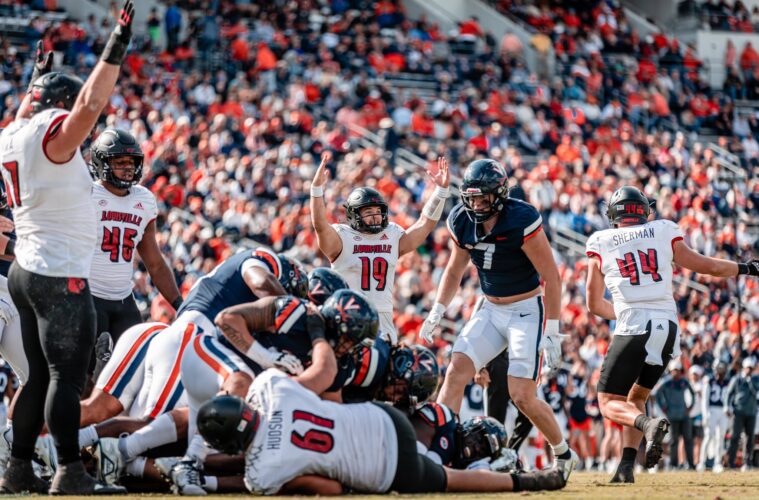
We are midway through the 2022 season for Louisville Football. Here is a look at the 4 year trends under Scott Satterfield. Keep in mind averages are more apples to apples than season total comparisons. Often the ranking is the best way to measure performance Year over Year as conditions around the sport do change.
| – | 2022 | 2021 | 2020 | 2019 |
| Strength of Schedule (Sagarin) | 40th | 38th | 70th | 46th |
| Scoring Offense (ppg) | 27.7 (80th) | 31.6 (40th) | 29.5 (55th) | 33.1 (30th) |
| Total Offense (ypg) | 437.2 (43rd) | 448.4 (21st) | 444.2 (29th) | 447.3 (24th) |
| Passing Offense (ypg) | 230.0 (83rd) | 235.5 (64th) | 244.2 (48th) | 234.5 (65th) |
| Rushing Offense (ypg) | 207.17 (24th) | 212.92 (18th) | 200.00 (29th) | 212.85 (24th) |
| Scoring Defense (ppg) | 22.3 (47th) | 27.3 (77th) | 26.6 (49th) | 33.4 (110th) |
| Total Defense (ypg) | 361.3 (57th) | 401.3 (83rd) | 369.1 (39th) | 439.9 (102nd) |
| Passing Defense (ypg) | 227.5 (65th) | 244.6 (94th) | 189.2 (17th) | 234.2 (79th) |
| Rushing Defense (ypg) | 133.83 (53rd) | 156.69 (73rd) | 179.91 (80th) | 205.77 (112th) |
| Yards Per Point | 15.8 (93rd) | 14.1 (52nd) | 15.0 (89th) | 13.6 (43rd) |
| 3rd Down Conversion % | 39.76% (64th) | 40.23% (66th) | 44.76% (34th) | 43.68% (31st) |
| 4th Down Conversion % | 37.5% (103rd) | 50.00% (72nd) | 54.17% (66th) | 59.09% (37th) |
| Opponent 3rd Down Conversion % | 33.33% (37th) | 38.42% (61st) | 39.86% (57th) | 38.15% (54th) |
| Opponent 4th Down Conversion % | 22.22% (10th) | 50.00% (54th) | 40.00% (20th) | 43.48% (34th) |
| First Downs (per game) | 22.3 (50th) | 21.2 (63rd) | 20.9 (65th) | 20.2 (84th) |
| Opponent First Downs (per game) | 18.0 (35th) | 22.2 (95th) | 18.2 (21st) | 22.0 (91st) |
| Turnover Margin (season) | 1 (52nd) | 2 (52nd) | -12 (118th) | -1 (69th) |
| Time of Possession | 31:16.83 (42nd) | 30:51.77 (33rd) | 31:30.36 (32nd) | 31:27.23 (33rd) |
| Red Zone Conversion % | 84.0% (41st) | 86.67% (38th) | 88.64% (31st) | 81.82% (78th) |
| Red Zone TD Conversion % | 52.00% (108th) | 66.67% (33rd) | 65.91% (45th) | 68.18% (32nd) |
| Red Zone Trips | 25 (41st) | 45 (76th) | 44 (28th) | 44 (84th) |
| Opponent Red Zone Conversion % | 68.18% (12th) | 89.80% (110th) | 82.93% (57th) | 84.31% (71st) |
| Opponent Red Zone TD Conversion % | 50.0% (33rd) | 65.31% (99th) | 60.98% (56th) | 74.51% (126th) |
| Opponent Red Zone Trips | 22 (74th) | 49 (82nd) | 41 (91st) | 51 (92nd) |
| Sacks (Per Game) | 3.67 (5th) | 2.54 (46th) | 1.91 (82nd) | 2.08 (69th) |
| Tackles for Loss (Per Game) | 7.5 (12th) | 6.23 (53rd) | 5.64 (80th) | 6.08 (59th) |
| Sacks Allowed (Per Game) | 1.83 (62nd) | 1.54 (25th) | 2.64 (92nd) | 3.08 (118th) |
| Tackles for Loss Allowed (Per Game) | 4.67 (43rd) | 5.00 (28th) | 8.46 (121st) | 9.92 (130th) |
| Penalties (ypg) | 68.8 (108th) | 54.9 (73rd) | 52.0 (65th) | 60.0 (92nd) |
| Interceptions Gained (season) | 8 (14th) | 10 (60th) | 5 (80th) | 7 (100th) |
| Passes Defended (per game) | 3.5 (102nd) | 4.23 (50th) | 4.27 (51st) | 4.23 (67th) |
| Fumbles Recovered (season) | 4 (43rd) | 5 (88th) | 13 (32nd) | 11 (15th) |
| Fumbles Forced (season) | 3 (76th) | 5 (114th) | 10 (21st) | 15 (9th) |
| Fumbles Lost (season) | 5 (96th) | 7 (57th) | 7 (65th) | 10 (91st) |
| Fumbles (season) | 7 (68th) | 16 (70th) | 18 (113th) | 20 (93rd) |
| Interceptions Lost (Season) | 5 (87th) | 6 (15th) | 12 (113th) | 7 (100th) |
The following two tabs change content below.


@UofLSheriff50. Louisville native, University of Louisville Business School Grad c/o 2004. Co-Founder of TheCrunchZone.com
Latest posts by Mark Blankenbaker (see all)
- Pat Kelsey Officially Adds Kloman, Carr, Hamilton, Foy to Staff - April 11, 2024
- Louisville Athletics, 502Circle Announce Membership Campaign - April 1, 2024
- VIDEO: Pat Kelsey Introductory Press Conference - March 29, 2024

