
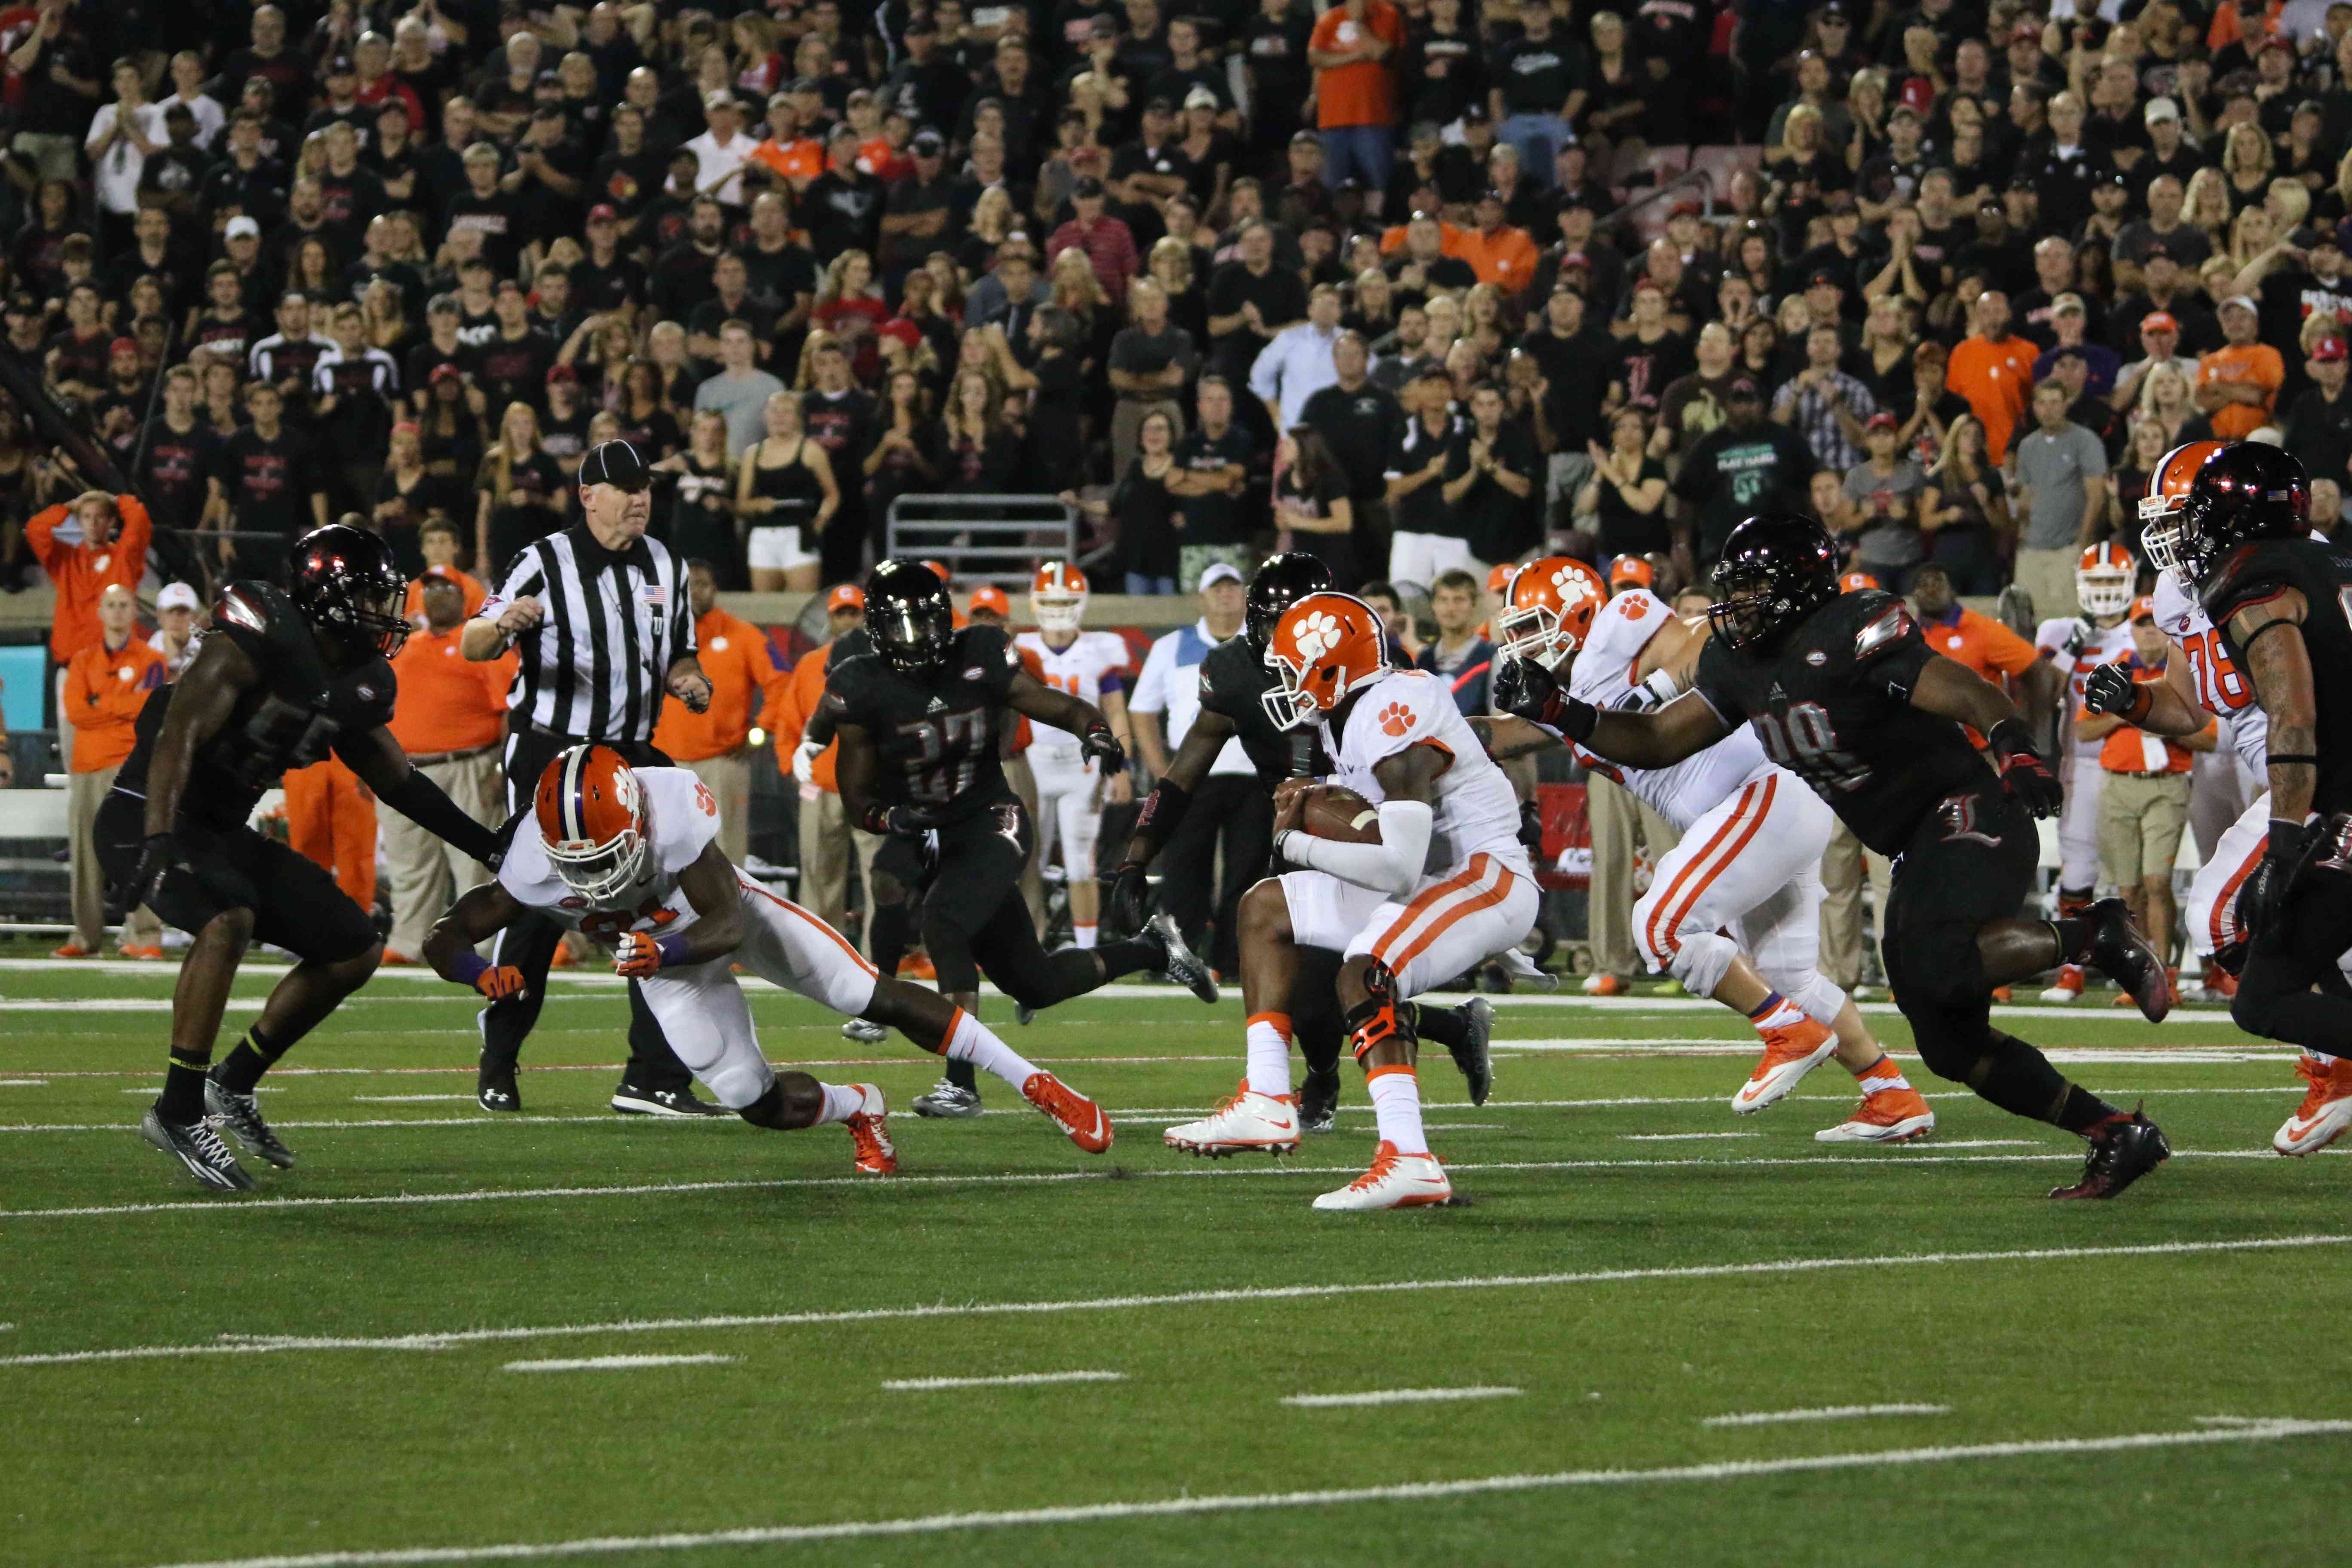
Louisville’s Defense has held the Clemson offense mostly in check over the past two seasons……but the Tigers were able to put up enough points to win the game. A punt return for a TD allowed Clemson to win the 2014 match-up despite CU gaining just 229 yards. In 2015 at Papa John’s a youthful Tiger Offensive Line was able to get necessary yards late in the game with Wayne Gallman. Still Louisville held Clemson to 23 points in 2014 & 20 points in 2015……and lost.
Todd Grantham’s defense has done a nice job against Clemson, but it hasn’t been good enough to win. In 2014 it was a late drive where the Tigers worked the flats and forced the Cardinal secondary to tackle in space. In 2015 Louisville just wasn’t physical enough in the 4th quarter.
This year Clemson’s offensive line has had its struggles. There has been a lot of mixing and matching along the Tiger offensive front and Clemson has given up some uncharacteristic pressure. Additionally the Tigers just haven’t been as explosive as they have been in year’s past, but Clemson started slow a year ago, got rolling in October and played in the National Championship game. Maybe they are following the same formula? The Tigers have plenty of talent and the Louisville Defense might be the biggest test for Clemson in the 2016 regular season.
Let’s take a look at a few charts to find some predictive ranges.
Scoring
| Scoring Defense | Clemson Scored vs. | Deviation from Avg. | % Scored of Avg | |
| @ Auburn – W | 18.8 | 19 | 0.2 | 101.06% |
| Troy -W | 21.0 | 30 | 9 | 142.86% |
| @ Georgia Tech- W | 14.3 | 26 | 11.7 | 181.82% |
| Louisville | 22.5 | Average | 6.9666666667 | 141.91% |
Using the 3 games above and with what Louisville allows Clemson should score 29.46-31.92 points according to this chart.
| Scoring Offense | Louisville Allowed vs. | Deviation from Avg. | % Scored of Avg | |
| Charlotte – W | 25.0 | 14 | -11 | 56.00% |
| @ Syracuse – W | 28.0 | 28 | 0 | 100.00% |
| Florida State – W | 43.0 | 20 | -23 | 46.51% |
| @ Marshall – W | 42.7 | 28 | -14.7 | 65.57% |
| Clemson | 33.5 | Average | -12.175 | 67.02% |
Using the 3 games above and with what Louisville allows Clemson should score 21.325-22.45 points according to this chart.
Total Yardage
| Total Defense | Clemson Gained vs. | Deviation from Avg. | % Gained of Avg | |
| @ Auburn – W | 385.3 | 399 | 13.70 | 103.56% |
| Troy -W | 407.0 | 414 | 7.00 | 101.72% |
| @ Georgia Tech- W | 339.3 | 442 | 102.70 | 130.27% |
| Louisville | 278.3 | Average | 41.133 | 111.85% |
Using the 3 games above with and with what Louisville allows Clemson should gain 311.28-319.43 yards according to this chart.
| Total Offense | Louisville Allowed vs. | Deviation from Avg. | % Gained of Avg | |
| Charlotte – W | 374.8 | 208 | -166.8 | 55.50% |
| @ Syracuse – W | 496.5 | 414 | -82.5 | 83.38% |
| Florida State – W | 487.3 | 284 | -203.3 | 58.28% |
| @ Marshall – W | 432.3 | 207 | -225.3 | 47.88% |
| Clemson | 452.5 | Average | -169.475 | 61.26% |
Using the 3 games above with and with what Louisville allows Clemson should gain 277.20-283.025 yards according to this chart.
Passing Yardage
| Passing Defense | Clemson Gained vs. | Deviation from Avg. | % Gained of Avg | |
| @ Auburn – W | 218.3 | 248 | 29.7 | 113.61% |
| Troy -W | 290.3 | 292 | 1.7 | 100.59% |
| @ Georgia Tech- W | 218.3 | 304 | 85.7 | 139.26% |
| Louisville | 156.3 | Average | 39.033 | 117.82% |
Using the 3 games above with and with what Louisville allows Clemson should gain 184.15-195.33 yards according to this chart.
| Passing Offense | Louisville Allowed vs. | Deviation from Avg. | % Gained of Avg | |
| Charlotte – W | 207.8 | 160 | -47.8 | 77.00% |
| @ Syracuse – W | 371.8 | 293 | -78.8 | 78.81% |
| Florida State – W | 242.5 | 113 | -129.5 | 46.60% |
| @ Marshall – W | 272.7 | 59 | -213.7 | 21.64% |
| Clemson | 293.0 | Average | -117.450 | 56.01% |
Using the 3 games above with and with what Louisville allows Clemson should gain 164.11-175.55 yards according to this chart.
Rushing Yardage
| Rushing Defense | Clemson Gained vs. | Deviation from Avg. | % Gained of Avg | |
| @ Auburn – W | 167.00 | 151 | -16 | 90.42% |
| Troy -W | 116.75 | 122 | 5.25 | 104.50% |
| @ Georgia Tech- W | 121.00 | 138 | 17 | 114.05% |
| Louisville | 122.00 | Average | 2.0833333333 | 102.99% |
Using the 3 games above with and with what Louisville allows Clemson should gain 124.08-125.65 yards according to this chart.
| Rushing Offense | Louisville Allowed vs. | Deviation from Avg. | % Gained of Avg | |
| Charlotte – W | 167.00 | 48 | -119 | 28.74% |
| @ Syracuse – W | 124.75 | 121 | -3.75 | 96.99% |
| Florida State – W | 244.75 | 171 | -73.75 | 69.87% |
| @ Marshall – W | 159.67 | 148 | -11.67 | 92.69% |
| Clemson | 159.5 | Average | -52.043 | 72.07% |
Using the 3 games above with and with what Louisville allows Clemson should gain 107.46-114.95 yards according to this chart.
Latest posts by Mark Blankenbaker (see all)
- Pat Kelsey Adds Associate Head Coach Sean Dixon - April 10, 2026
- Baseball: Cardinals Take 4-2 Loss at Kentucky - April 7, 2026
- Pat Kelsey Hires John Andrzejek as Associate Head Coach - April 6, 2026