
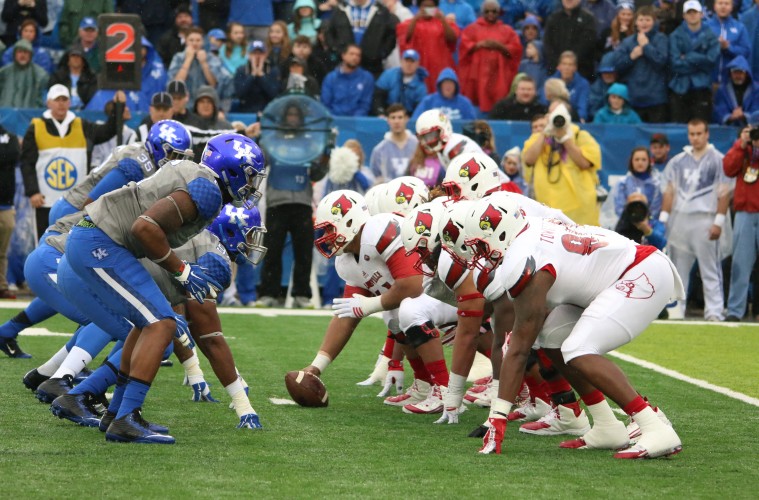
The Louisville Cardinals host the Kentucky Wildcats at Papa John’s Cardinal Stadium on Saturday in the battle for the Governor’s Cup. Here is the statistical comparison.
| Louisville | Kentucky | |
| Strength of Schedule | 62nd | 66th |
| Scoring Offense (ppg) | 46.0 (1st) | 30.1 (60th) |
| Total Offense (ypg) | 558.5 (1st) | 414.4 (63rd) |
| Passing Offense (ypg) | 303.9 (15th) | 172.0 (111th) |
| Rushing Offense (ypg) | 254.64 (12th) | 242.36 (17th) |
| Scoring Defense (ppg) | 21.7 (24th) | 30.5 (78th) |
| Total Defense (ypg) | 292.2 (7th) | 428.5 (82nd) |
| Passing Defense (ypg) | 193.0 (26th) | 208.5 (40th) |
| Rushing Defense (ypg) | 99.18 (6th) | 220.00 (105th) |
| Punt Returns (ypr) | 9.50 (44th) | 8.43 (53rd) |
| Kickoff Returns (ypr) | 21.21 (61st) | 22.58 (35th) |
| Opponent Punt Returns (ypr) | 9.20 (86th) | 5.42 (33rd) |
| Opponent Kickoff Returns (ypr) | 20.71 (71st) | 18.95 (39th) |
| Punting (ypp) | 42.30 (38th) | 39.43 (96th) |
| Field Goal % | 71.4% (78th) | 81.3% (28th) |
| Opponent Field Goal % | 69.2% (38th) | 70.0 (45th) |
| First Downs (per game) | 26.2 (6th) | 19.6 (93rd) |
| Opponent First Downs (per game) | 16.6 (14th) | 22.5 (93rd) |
| Penalties (ypg) | 74.1 (123rd) | 45.7 (30th) |
| Turnover Margin (season) | -5 (104th) | -8 (112th) |
| Time of Possession | 29:17.82 (75th) | 29:48.91 (65th) |
| Sacks (per game) | 2.64 (26th) | 1.64 (94th) |
| Sacks Allowed (per game) | 3.27 (121st) | 2.36 (86th) |
| Tackles for Loss (per game) | 24th (7.27) | 5.18 (95th) |
| Tackles for Loss Allowed (per game) | 5.91 (71st) | 6.09 (82nd) |
| Interceptions (season) | 13 (20th) | 10 (47th) |
| Passes Defended (per game) | 4.45 (56th) | 3.73 (96th) |
| Fumbles Recovered (season) | 9 (34th) | 7 (59th) |
| Fumbles Forced (season) | 11 (31st) | 6 (97th) |
| Fumbles Lost (season) | 20 (128th- LAST) | 14 (124th) |
| Kicks/Punts Blocked (season) | 2 (33rd) | N/A |
| 3rd Down Conversions (%) | 43.05% (47th) | 37.33% (90th) |
| Opponent 3rd Down Conversions (%) | 27.98% (6th) | 43.87% (102nd) |
| 4th Down Conversions (%) | 69.23% (9th) | 81.82% (3rd) |
| Opponent 4th Down Conversions (%) | 44.44% (43rd) | 40.00% (30th) |
| Red Zone Conversions (%) | 84.85% (55th) | 86.49% (45th) |
| Opponent Red Zone Conversions (%) | 86.67% (83rd) | 81.08% (48th) |
| RedZone TD Conversions (%) | 65.15% (45th) | 62.16% (62nd) |
| Opponent Red Zone TD Conversions (%) | 63.33% (79th) | 59.46% (50th) |
| Kickoffs (ypk) | 59.67 (97th) | 61.64 (58th) |
| Plays | 828 (28th) | 730 (104th) |
| Yards Per Play | 7.42 (4th) | 6.24 (37th) |
The following two tabs change content below.


@UofLSheriff50. Louisville native, University of Louisville Business School Grad c/o 2004. Co-Founder of TheCrunchZone.com
Latest posts by Mark Blankenbaker (see all)
- Cards Advance to NCAA 2nd Round With Win Over South Florida 83-79 - March 19, 2026
- VIDEO: Pat Kelsey, Conwell, Fru & McKneely South Florida Post-Game (1st Round) - March 19, 2026
- UofL Statement on Mikel Brown’s Health - March 18, 2026