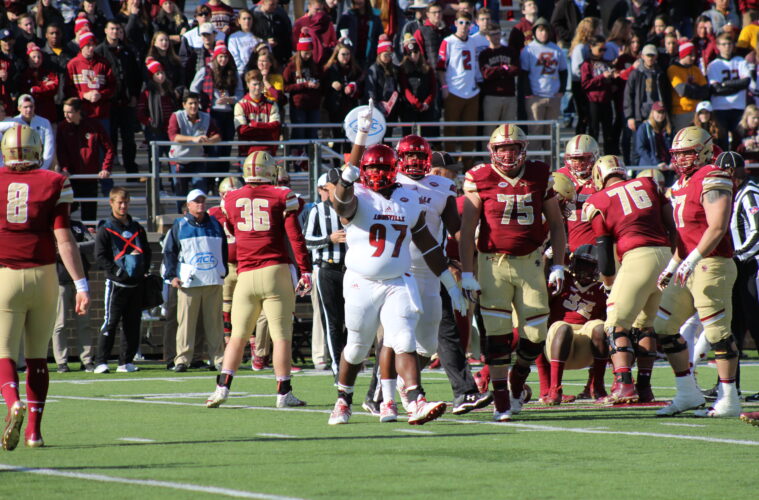
Louisville will travel to Chestnut Hill on Saturday to face the Boston College Eagles. BC is 4-2 on the season and battled with undefeated NC State last week without standout running back AJ Dillon.
UofL’s offense has grown dramatically over the past two weeks, but that growth isn’t yet reflected in the overall national rankings. Defensively the Cards took a major step backward against Georgia Tech.
The Boston College game will challenge UofL upfront on both sides of the ball. The Cards have struggled to win the line of scrimmage and BC wins the line of scrimmage. The Eagles are a power football team.
The good news for UofL is that BC’s defense is vulnerable (UofL’s is too) so I expect a great deal of points in this match-up and Louisville has to take care of the ball if they expect to be in this one and they have to TACKLE defensively. The Eagles aren’t overly scary, but they do things the right way and they take advantage of their opponent’s mistakes. It’s not out of the realm of possibility that UofL CAN win. But it’s hard to predict that until we see the Cards actually get a W to snap a 3-game losing streak.
|
130 teams in College Football
|
||
| Louisville | Boston College | |
| Strength of Schedule (Sagarin) | 48th | 63rd |
| Scoring Offense (ppg) | 20.5 (121st) | 39.8 (25th) |
| Total Offense (ypg) | 340.2 (115th) | 450.3 (40th) |
| Passing Offense (ypg) | 221.3 (80th) | 227.5 (75th) |
| Rushing Offense (ypg) | 118.83 (113th) | 222.83 (26th) |
| Scoring Defense (ppg) | 32.7 (98th) | 27.0 (74th) |
| Total Defense (ypg) | 413.8 (93rd) | 408.0 (88th) |
| Passing Defense (ypg) | 182.8 (27th) | 232.5 (78th) |
| Rushing Defense (ypg) | 231.0 (118th) | 175.50 (84th) |
| Punt Returns (ypr) | 16.44 (20th) | 13.3 (33rd) |
| Kickoff Returns (ypr) | 21.63 (56th) | 23.29 (34th) |
| Opponent Punt Returns (ypr) | 10.69 (91st) | 11.87 (98th) |
| Opponent Kickoff Return (ypr) | 19.88 (46th) | 19.46 (41st) |
| Punting (ypp) | 42.69 (44th) | 35.77 (126th) |
| Field Goal % | 100% (1st) | 100% (1st) |
| Opponent FG % | 55.6% (25th) | 50.0% (17th) |
| First Downs (per game) | 19.3 (100th) | 21.0 (71st) |
| Opponent First Downs (per game) | 20.5 (75th) | 22.2 (93rd) |
| Penalties (ypg) | 61.7 (75th) | 48.2 (42nd) |
| Turnover Margin (season) | -10 (129th) | 7 (10th) |
| Time of Possession | 28:24.83 (97th) | 27:12.83 (113th) |
| Sacks (Per Game) | 1.0 (118th) | 3.0 (20th) |
| Tackles for Loss (Per Game) | 3.67 (122nd) | 7.5 (25th) |
| Sacks Allowed (Per Game) | 2.83 (105th) | 1.83 (56th) |
| Tackles for Loss Allowed (Per Game) | 6.67 (94th) | 6.0 (66th) |
| Interceptions Gained (season) | 2 (107th) | 10 (4th) |
| Passes Defended (per game) | 2.17 (127th) | 6.5 (11th) |
| Fumbles Recovered (season) | 2 (95th) | 6 (13th) |
| Fumbles Forced (season) | 2 (107th) | 6 (28th) |
| Fumbles Lost (season) | 5 (95th) | 5 (95th) |
| Interceptions Lost (Season) | 9 (123rd) | 4 (50th) |
| Kick/Punts Blocked (season) | 1 (36th) | 2 (10th) |
| 3rd Down Conversion % | 39.24% (69th) | 35.29% (103rd) |
| 4th Down Conversion % | 40.00% (103rd) | 50.00% (73rd) |
| Opponent 3rd Down Conversion % | 48.24% (120th) | 38.54% (73rd) |
| Opponent 4th Down Conversion % | 60.00% (85th) | 62.5% (92nd) |
| Red Zone Conversion % | 81.25% (90th) | 85.71% (62nd) |
| Red Zone TD Conversion % | 62.5% (74th) | 76.19% (23rd) |
| Red Zone Trips | 16 (101st) | 21 (57th) |
| Opponent Red Zone Conversion % | 84.00% (67th) | 68.0% (7th) |
| Opponent Red Zone TD Conversion % | 68.00% (87th) | 56.00% (46th) |
| Opponent Red Zone Trips | 25 (110th) | 25 (110th) |
| Kickoffs (ypk) | 59.73% (102nd) | 61.77 (66th) |
| Plays | 391 (62nd) | 441 (22nd) |
| Yards Per Play | 5.22 (104th) | 6.13 (47th) |
| Plays +10 Yards | 82 (55th) | 84 (50th) |
| Plays +20 Yards | 23 (89th) | 38 (12th) |
| Plays +30 Yards | 10 (83rd) | 17 (18th) |
| Plays +40 Yards | 4 (97th) | 8 (32nd) |
| Opponent Plays +10 Yards | 78 (76th) | 80 (82nd) |
| Opponent Plays +20 Yards | 26 (73rd) | 29 (91st) |
| Opponent Plays +30 Yards | 13 (92nd) | 11 (63rd) |
| Opponent Plays +40 Yards | 5 (49th) | 5 (49th) |
Latest posts by Mark Blankenbaker (see all)
- Cardinals Lose to Kentucky 17-13 in Battle of the Bluegrass - April 17, 2024
- Pat Kelsey Officially Adds Kloman, Carr, Hamilton, Foy to Staff - April 11, 2024
- Louisville Athletics, 502Circle Announce Membership Campaign - April 1, 2024

