
When Louisville takes the field September 1st against Charlotte, fans, coaches, and everyone else will attempt to analyze the Cards performance. Should they have scored more points than they did against a sub par team? Did they score more than we even expected? And how well did the defense do comparatively speaking? These are all questions we are attempting to answer in a definitive way, therefore we turn to statistics. Now, before we begin, it is important to note that we are not Ken Pomeroy nor do we hold any key to predicting football games. All we are trying to do is use simple statistics to give us a representation of Louisville’s per game efficiency.
The Methodology:
First, it is important to understand what the S&P+ rankings, which can be found HERE are:
The S&P+ Ratings are a college football ratings system derived from the play-by-play and drive data of all 800+ of a season’s FBS college football games (and 140,000+ plays).
The components for S&P+ reflect opponent-adjusted components of four of what Bill Connelly has deemed the Five Factors of college football: efficiency, explosiveness, field position, and finishing drives. (A fifth factor, turnovers, is informed marginally by sack rates, the only quality-based statistic that has a consistent relationship with turnover margins.)
From this S&P+ system, you get offensive and defensive ratings:
- Off. S&P+ rating: A team’s offense-specific S&P+ rating, presented in the form of an adjusted scoring average.
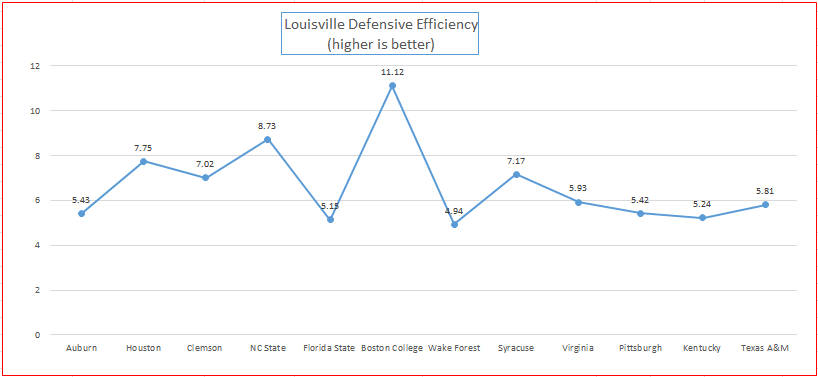
- Def. S&P+ rating: A team’s defense-specific S&P+ rating, presented in the form of an adjusted scoring average (and since this is defense, the lower the average, the better).
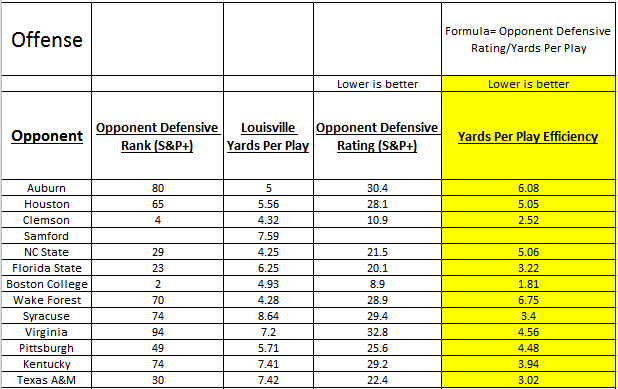
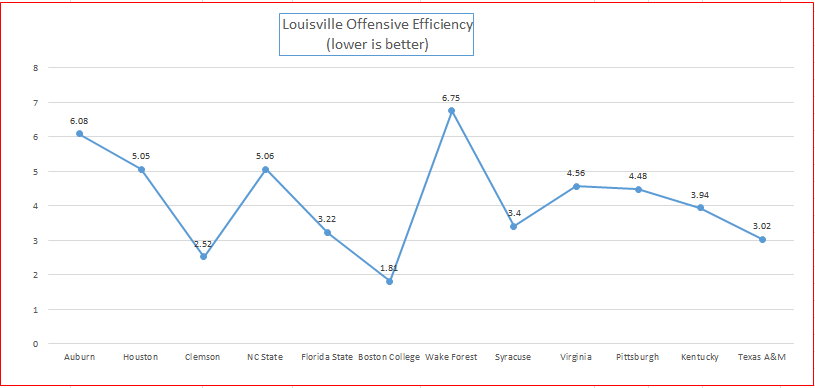
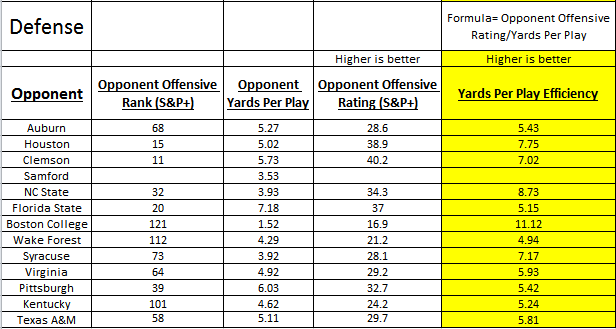
When we set out to find a single number that can summarize what happened in a game, we came up with yards per play. Yards per play tends to remove “fluke” factors that can be biased, such as points. A team could theoretically score 5 defensive touchdowns (35 points) whereas another team could score 3 offensive touchdowns (21) and you would immediately assume just by looking at points that the 35>21 so the team with 35 points had the better offense. That is just one example. Yards per play gives an average over the entire game of how your team moved the ball on an opponent or how they moved the ball on you, plain and simple.
**Note: I use the offensive/defensive S&P+ ratings for the opponent that is updated from the previous week’s game and before they play Louisville to give as good of an indication as possible to how that team is playing.
Therefore with knowing these 2 statistics, the offensive/defensive S&P+ rating and the yards per play, we are able to compare these numbers to indicate how well Louisville plays on both offense and defense against their opponents. I have included the stats and the charts from last year as an example. Look for these posts to come following every Louisville football game this year!
Chris Person
Latest posts by Chris Person (see all)
- Analyzing Louisville’s 2017 Defensive Front Seven Recruiting Class - February 1, 2017
- 4-Star Offensive Lineman Mekhi Becton Commits To Louisville - February 1, 2017
- 3-Star Offensive Lineman Toryque Bateman Commits To Louisville - January 30, 2017