

If one were to try to quantify the season for UofL where would you begin? Exactly where is the football program at as a whole and where are they headed? These were a couple questions that I pondered after the game Saturday against Boston College. Sure, the defense played a great game, but weren’t they supposed to do that against such a poor offense? At the same time the offense struggled. Was this poor play or did the opposing defense dictate this? This led me on a quest to try and put into perspective how UofL has performed given their competition.
Before we begin let’s keep in mind that there is no perfect way of doing this. Statistics can’t tell the whole story, but it can give an indication of what is happening. This is a fairly simple formula that does have many possible errors associated with it. With that being said, the following data gives an idea of how UofL has done against their opponents and if they are progressing/regressing.
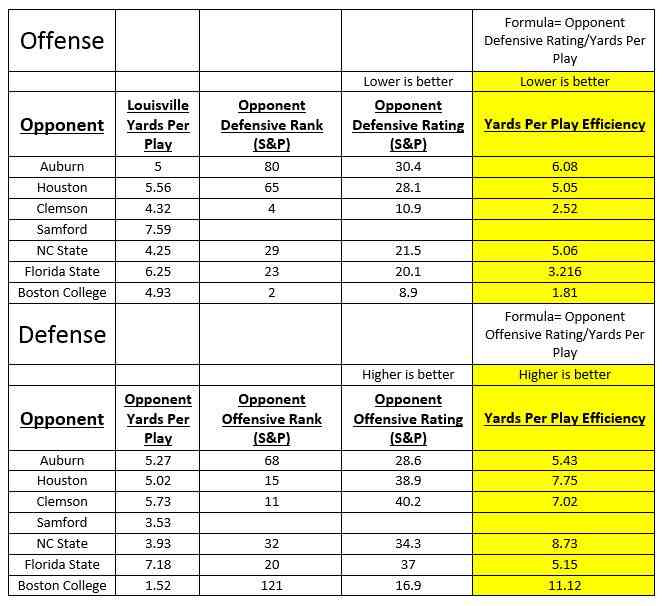
To compute “Yards Per Play Efficiency” I decided to divide the Opponent Offensive/Defensive Rating (S&P) by Louisville/Opponent Yards per play. For offense, the lower the number the better and for defense, the higher number the better.
**This does not include the Samford game since they are not listed in the S&P index**
Couple quick notes:
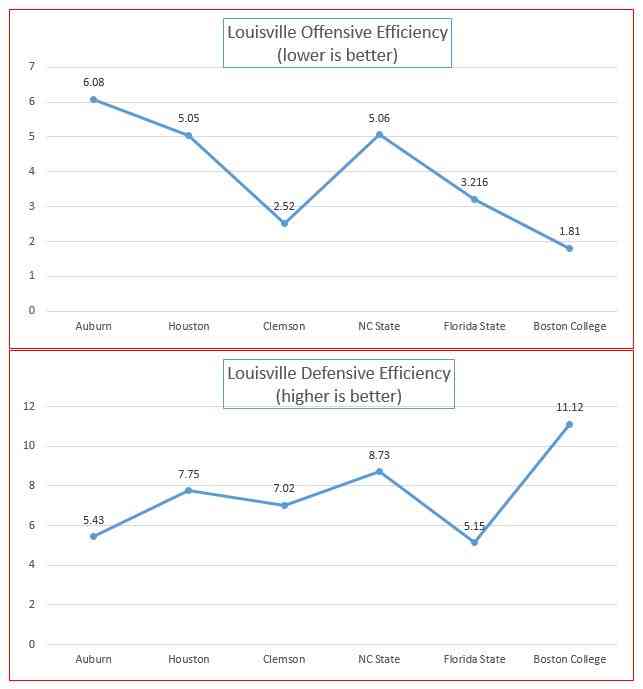
-Overall it appears Louisville is improving as the season progresses in both offensive efficiency and defensive efficiency (minus the Florida St. game).
-Not only did Louisville had a great game defensively against Boston College, but the offense also performed very well given the level of competition.
-As the season goes on I will keep this updated to track the progress.
Chris Person
Latest posts by Chris Person (see all)
- Analyzing Louisville’s 2017 Defensive Front Seven Recruiting Class - February 1, 2017
- 4-Star Offensive Lineman Mekhi Becton Commits To Louisville - February 1, 2017
- 3-Star Offensive Lineman Toryque Bateman Commits To Louisville - January 30, 2017