

By Greg Hydes (SteelCard)
The old adage of offense winning games and defense winning championships is a true statement; however, it is not the whole story.
The answer: both are required. But over the BCS years, many other factors play into the final rankings or pairings. “When” a team loses a game also dictates how they will finish. For example, if Alabama (2-time defending Champion) had lost to Auburn in the first game of last season….would they have played for the National Title? Who knows, but that loss would have been long forgotten and there is a chance that some of the opponents of Auburn would have gotten a little more “up” for their games. And certainly, Alabama would not say they were disinterested for the rest of the season versus their one bowl game against Oklahoma.
Since the 2003/04 season, 12 National Champions have been crowned (USC and LSU split their title in 2003/04). Only 5 of those teams went undefeated. Six teams had one loss and one had 2 losses (LSU in 2007/08). Of the 8 combined losses during this period only 3 of these losses occurred in the second half of the season. Those teams were LSU and Alabama (twice). The only team ranked outside of the top 15 to win was the 2010/11 Auburn team. Oddly enough, the only team to go wire to wire in the polls was the 2004/05 USC team.
So…the question remains….who is the best? And what really matters statistically? That is the fun of college football and it keeps the fans talking for months. Frankly, until every FBS conference winner has a shot at getting in the “Big Dance” for football…..we may never really know. The 4 team playoff is a step in the right direction, but still is only 4 teams. After all there are 10 FBS conferences plus independents….hmmm…that’s another entry.
Most all of the computer models have some validity, but nearly all have some bias….. some more than others. Where a team starts dictates where they finish….. Seriously, who can truly say which team is the best without a game being played much less who is tenth, twentieth, and so on? Jeff Sagarin puts together the most significant and statistically correct ratings system. While he has admitted a bit of bias in the starting points, he keeps the results “insignificant” until after the first 3-4 games of the season. This is why the BCS rankings were never out before October.
Characteristics of a Championship Team
Below are the statistical characteristics of the National Championship teams since the 2003/04 season. The attempt is to determine the key factors for winning titles in college football. Additionally, U of L’s performance for comparison purposes.
Explanation:
The statistical analysis is rather simple. My background is in industry and six sigma. That said, the emphasis is on efficiency at this point. The hope is to develop a model that includes consistency as well. That will be as the season progresses. The inputs are straight forward and readily available to anyone. Inputs are as follows: Pass Efficiency, Pass Efficiency Defense, Rushing Efficiency, Rushing Efficiency Defense, and Special Teams Efficiency. Rushing efficiency and its defense were my calculations based upon the pass efficiency calculation and scaled to make the average team a rating of 100. To be basic, it is how a team shows efficiency on offense versus how that team performs against their opponents on defense. The difference is all that matters. The average team will have a rating of 110 using the NCAA calculation for passing efficiency and my calculation for rushing efficiency.
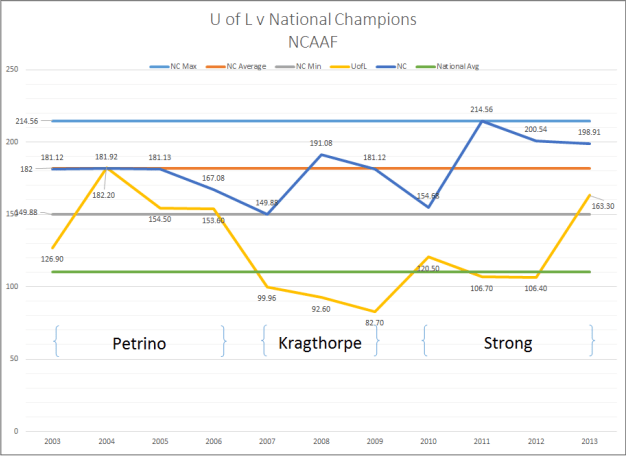
The statistics above are an overall rating based on efficiency. The NC teams’ performance is outlined and bracketed it as a minimum, maximum, and average score. U of L’s performance is there as is the national average over the same time frame.
In terms of efficiency differential, the national title winners had a low of 149.88 (2-loss LSU in 2007/08) and a high of 214.56 (1-loss Alabama in 2011/12). The reading of these numbers are simple…. Using the average of 149.88, offensive efficiency is nearly 50% better than their opponents. This means the defense of the NC winner was 50% more efficient against their opponents relative to offensive efficiency.
The use of efficiency takes into account all aspects of play from the line of scrimmage. In this world of high octane offenses, while entertaining to watch, and their ability to get national attention from the networks, they do not win championships necessarily. Since the 2003/04 season, the team with the number one scoring offense has won the title twice (2005/06 Texas, 2013/14 FSU). Both of those teams had top ten scoring defenses. On average the NC winners score 39.5 points per game while giving up 14.3 points per game. When looking at the national leaders in yards per game over the same time span…. there is even more disparity in terms of overall team performance. The national leaders in offensive yards per game had an average defensive national rank of 74.7 and an average final ranking of 24.4. Only two teams during that period ranked in the top 25 in defense (2004 Louisville and 2010 Boise St.).
Looking at strictly defensive ratings, the number one team in yards per game shows 3 of 11 have won the NC. Analyzing points per game allowed, the numbers show the same 3 of 11 titles. The answer must be that a team has to be proficient in both offense and defense with a significant difference between themselves and their opponents.
Louisville Cardinals
The Cardinals have had very good success over the last 11 years, excluding the three years with Steve Kragthorpe. 2004, was statistically the best year for the Cardinals and what could have been if they held on to beat Miami…..!?!. Oddly enough last season was the second best year; defensively the Cards dominated and ran a very efficient offense. It was complained about by many about the vanilla schemes and such, however, it did prove to tie for the best record in school history. Comparing these great years, including the 2006 Orange Bowl team, to the National champions, the 2004 Louisville team was statistically equal to the NC winner. The other teams were in the NC range (we will call it) but at the
lower end. The year that is the largest haunting question is the 2007/2008 season….the Cards returned nearly all of the starting lineup and had one of their best recruiting years ever. If the coaching staff remained intact or at least the style of play was consistent, then could they have beaten a 2 loss LSU team for the title? Hard to say, but that would have been one fun ride to follow up a BCS bowl victory.
The idea behind this article is to provide a foundation of what will be used going forward as a base model. What developed from this base, is an adjustment for strength of schedule, and an adjustment for recruiting and returning players. This data will be used to develop a top 25 and will be posted shortly. The media and coaches polls will be analyzed based on these factors to predict “their” top teams’ final records. The data will be used to examine the teams on Louisville’s schedule. Additionally, subsequent articles tracking the Card’s opponents’ games each week and keeping up with the playoff race and conference races. Enjoy!
Greg Hydes
Latest posts by Greg Hydes (see all)
- Week 4 College Football Picks - September 24, 2015
- A Look at Louisville’s Defense - September 24, 2015
- Offensive Discipline: Louisville’s Focus Moving Forward - September 24, 2015